When “Rapid Decisions” Create Irreversible Ones
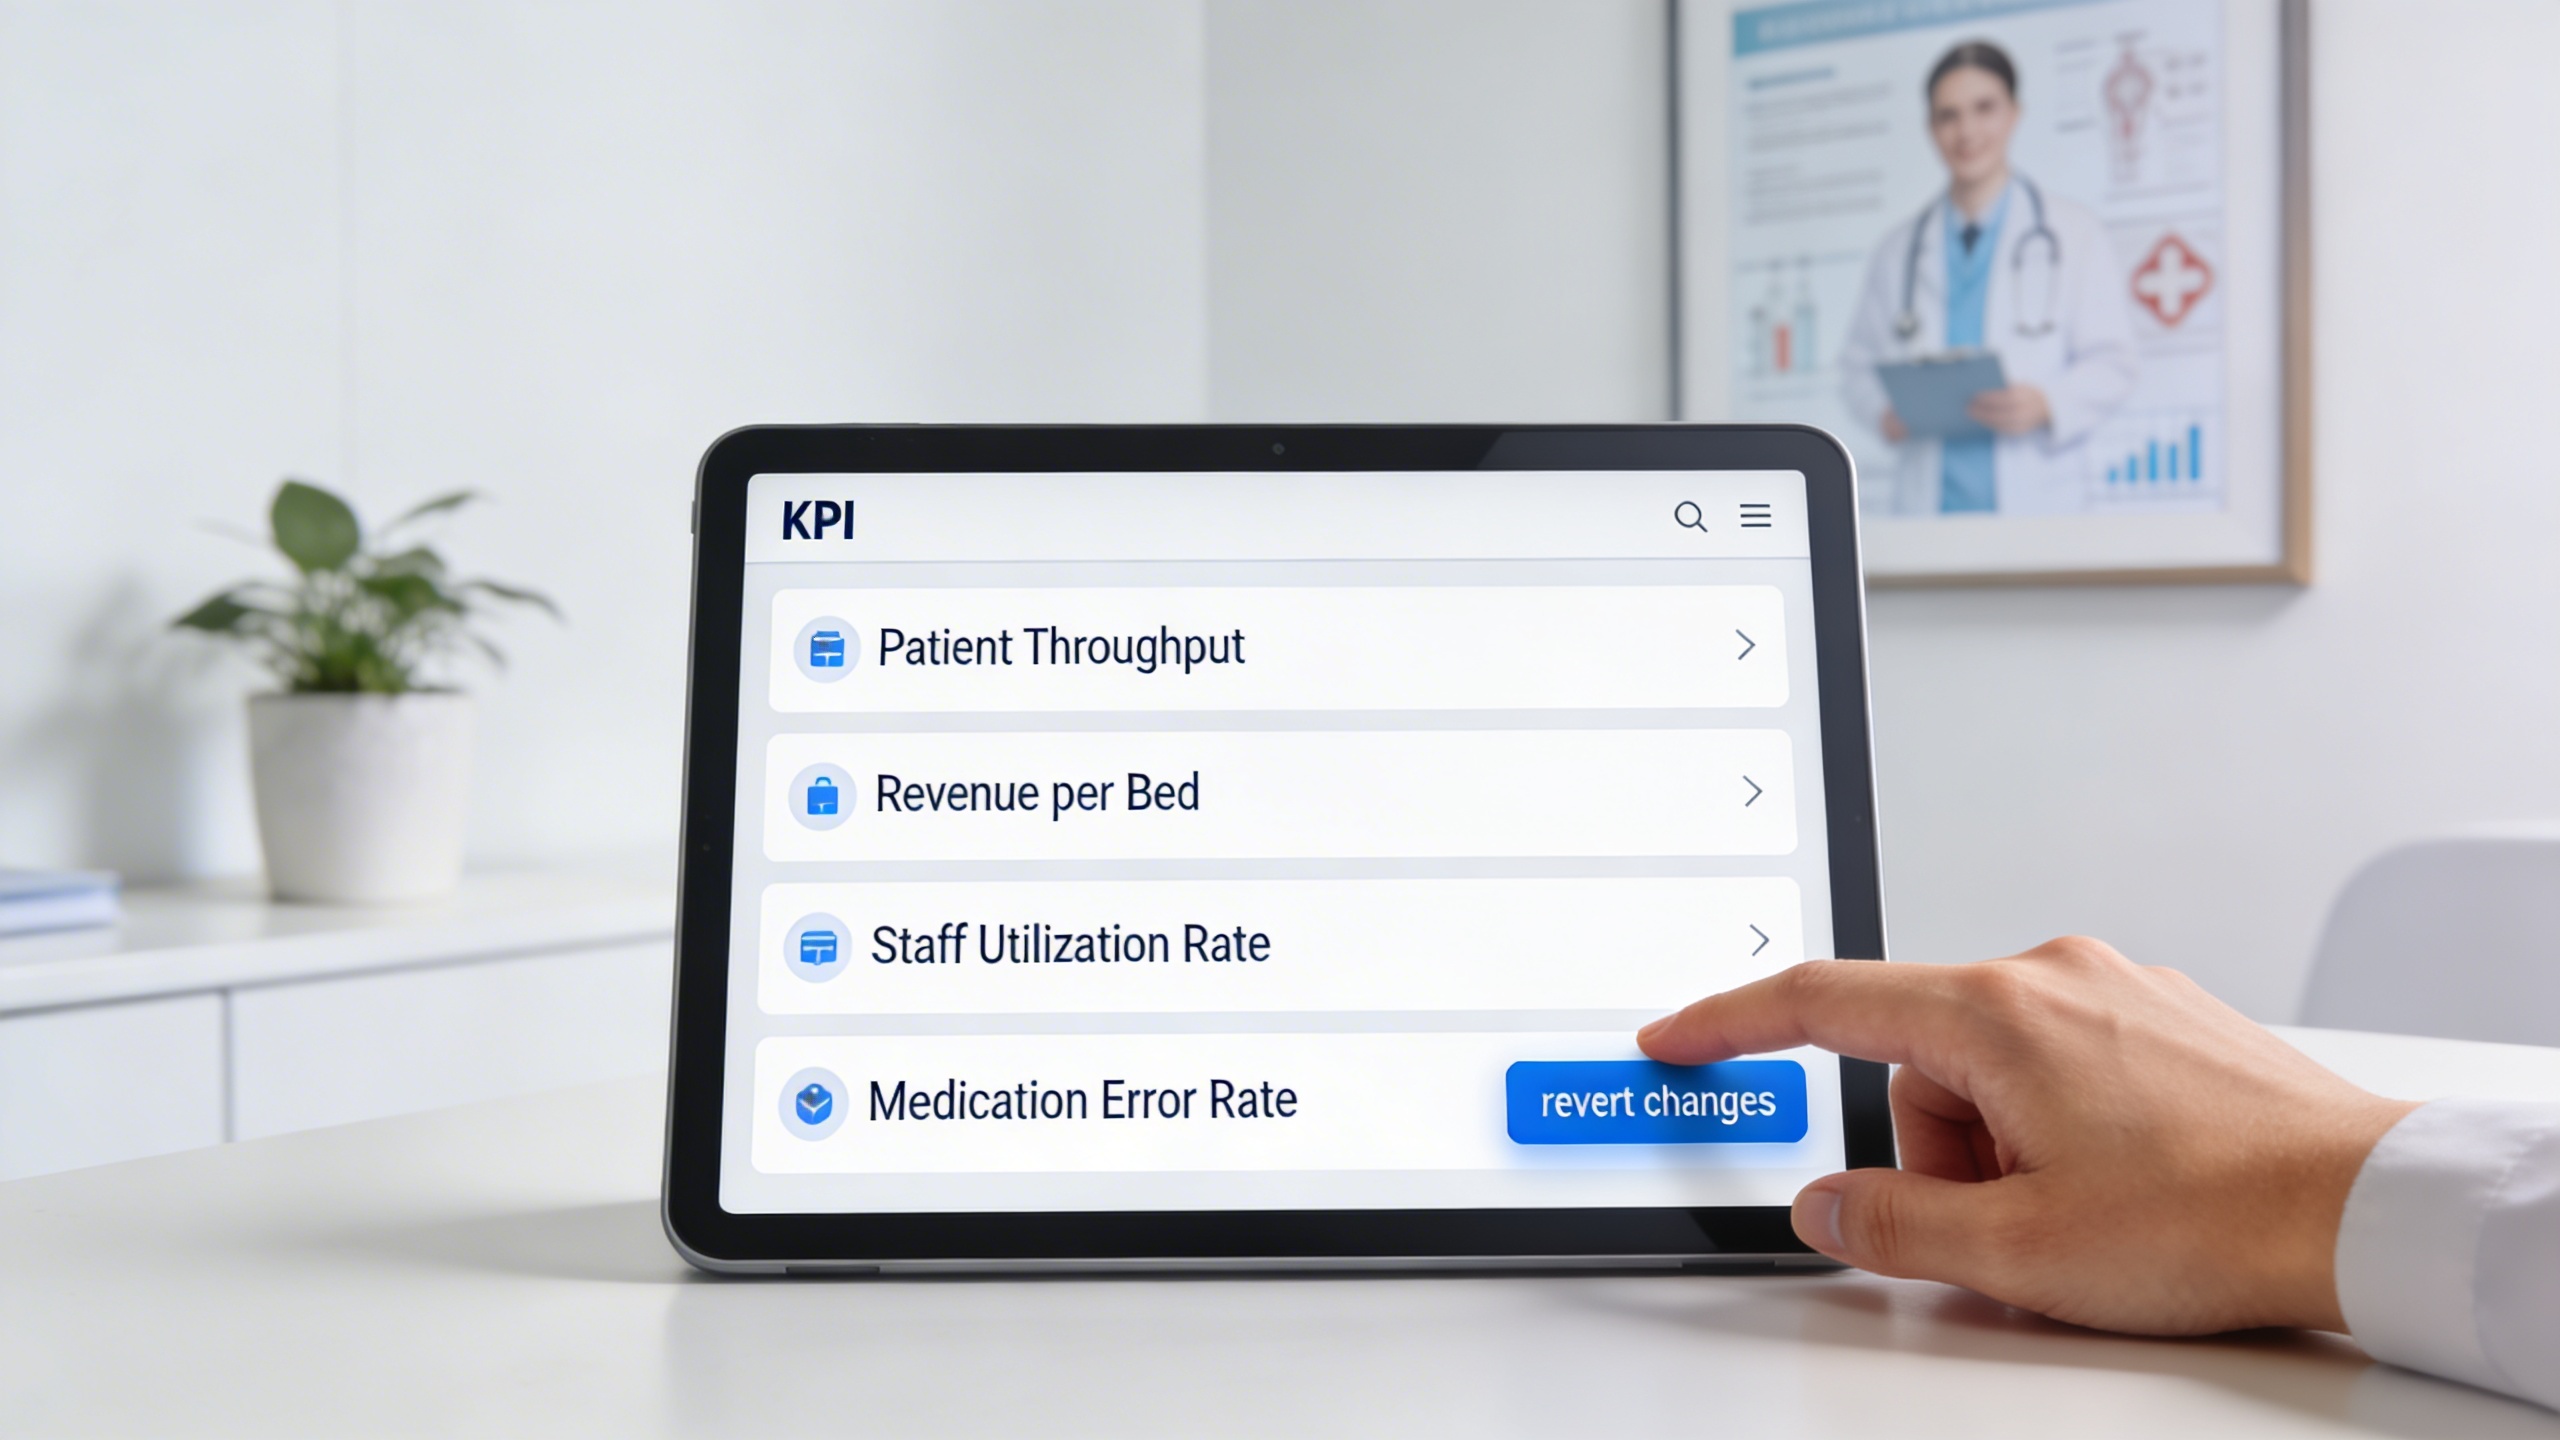
News reports highlighted that the medical corporation Mizuseikai Shibata Hospital implemented the management cloud service “freee,” constructing a “Management Dashboard” that centralizes financial, accounting, and payroll data. The articles touted “enabling rapid management decisions” as a major benefit.
Certainly, consolidating scattered data onto a single screen to visualize the management status in real-time is one ideal form of modern management. However, from the perspective of “reversible management,” I want to raise a crucial question here.
That is, whether “speed” is sacrificing “verifiability” and “decision reversibility.” When we become dependent on the “single truth” presented by a dashboard and lose the margin to verify the data generation processes and underlying assumptions, management decisions carry the risk of transforming into “irreversible decrees.”
The “Decision Black Box” Hidden by Dashboards
The greatest appeal of a unified dashboard is its ability to simplify complex reality and provide decision-makers with “instant insight.” However, this very process of simplification already contains significant judgments.
Which metrics are included on the dashboard? How are those metrics defined (e.g., the calculation method for “profitability”)? Are the rules for collecting and inputting source data thoroughly followed? What happens when “visualization” races ahead while these premises remain ambiguous?
A manager might see a figure like “KPI improved by 20%” displayed on the dashboard and become convinced of a strategy’s success. Yet, the process of verifying whether that number stems from a temporary factor (e.g., a temporary concentration of specific high-cost treatments) or is merely an apparent improvement due to a change in data input rules (e.g., a change in revenue recognition criteria) is often omitted.
In a retail company I assisted, there was no unified understanding among field staff regarding the allocation method of headquarters expenses in the “store-by-store gross profit margin” formula within the sales dashboard. As a result, discussions on store consolidation or closure arose based solely on the dashboard numbers, leading to confusion later when discrepancies in calculation premises were discovered. While dashboards accelerate decision-making, they simultaneously carry the danger of turning the rationale for decisions into a “black box.”
The Need for “Decentralized” Observation Before “Centralization”
So, from the perspective of “reversible management,” how should we design data utilization? The key is to intentionally establish “decentralized” observation points *before* pursuing “centralization.”
In the case of Mizuseikai Shibata Hospital, the state *before* centralization in “freee”—that is, the original financial data, accounting slips, and payroll statements (or their management methods) that were managed separately by each department—holds crucial information. In the centralization process, these “raw data” and “local insights” must not be discarded.
Concrete methods for such “reversibility design” could include the following:
1. Position Dashboard Implementation as a “Hypothesis Testing Tool”
Define the dashboard not as the “sole decision-making foundation,” but as “one lens for testing a hypothesis.” For example, when observing the phenomenon “labor cost ratio improved on the freee dashboard,” establish a habit of deliberately observing the same event through “different lenses,” such as traditional departmental Excel reports or interviews with on-site supervisors, to verify if it’s a genuine improvement.
2. Set “Verification Triggers” for Each Metric
Pre-design an automatic “verification process” triggered by anomalies or sudden changes in the dashboard’s key KPIs. For instance, if an alert like “monthly medical supply costs increased by 15% or more compared to the previous month” appears on the dashboard, institutionalize a mandatory two-step verification flow: confirmation with the purchasing manager (price increase or usage increase?) and verification of original invoices. This prevents blind obedience to dashboard numbers.
3. Schedule Regular Days to “Trace Data Back to Its Source”
Establish a “Data Traceability Day” on a regular basis, such as quarterly, to actually trace—even via sampling—how the dashboard’s key figures have been aggregated and processed from primary data like original slips or application forms. This is an effective “reversible” mechanism for early detection of shifts in data input rules or changes in field practices.
Measure the Success of Tool Implementation by Whether the “Exit Strategy” is Clear
Implementing excellent SaaS tools like “freee” greatly contributes to operational efficiency. However, from the principle of “reversible management,” the success of tool implementation should be evaluated not when “you start using it,” but by whether “the cost and process for stopping (or reverting to the previous state) are clear.”
Many tool implementation projects tend to focus only on the benefits and future vision of adoption, often neglecting the following points:
- Data Lock-in Risk: In what format and with what level of effort can data accumulated within the tool be extracted? Are standard export functions sufficient, or is API integration necessary?
- Degree of Embedment into Business Processes: When a tool’s workflow becomes deeply integrated with the company’s unique business judgments (e.g., specific insurance medical calculation rules for a hospital), the impact on operations upon leaving the tool becomes immense.
- Creation of Human Dependency: If tool administration or key users are concentrated in one person, both the tool’s operation and the business know-how embedded within it are lost if that person leaves.
To redesign the Mizuseikai Shibata Hospital case from a “reversible” perspective, it would be effective to design the following “exit strategy” in parallel with the freee implementation:
“One year after full implementation, if a decision is made to discontinue using freee, demonstrate during the pilot phase that the necessary data (general ledger, payroll statement history, etc.) can be completely exported in standard CSV format within 3 person-days of work.”
By preparing such a “proof of exit” in advance, you can prevent excessive dependence on or lock-in by the tool, maintaining a healthy relationship where the tool remains just “one of the options.”
Verifiability Over Speed: A Blueprint for Reversible Data-Driven Management
Rapid, data-driven management decisions are indeed a source of competitive advantage. However, if that speed compromises the quality and verifiability of decisions, it becomes meaningless.
What “reversible management” aims for is not an organization that blindly trusts the “single answer” of a dashboard, but an organization with the habit of questioning the phenomena the dashboard shows—”Is that true? How can we verify it?”—and conducting multi-faceted verification.
To achieve this, the criteria for adopting tools or systems must shift from the traditional “abundance of features” and “processing speed” to “whether it can preserve observational diversity,” “whether it can incorporate processes to verify premises,” and “whether it allows for appropriate withdrawal (or rollback) when necessary.”
A unified dashboard must not be the “endpoint” of management, but rather the “starting point” for deeper understanding and more flexible decision-making. How do we preserve the most crucial “margin”—the diversity of thought and the reversibility of judgment—in the very place where data is concentrated? That is the core question for “reversible management” in the DX era.

Comments